source: Data Science and Machine Learning Interview Questions
Common Normalization Functions
Z-Score
Converts all values to a z-score. The values in the column are transformed using the following formula:
Mean and standard deviation are computed for each column separately. Population standard deviation is used.
Min-Max
The min-max normalizer linearly rescales every feature to the [0,1] interval. Rescaling to the [0,1] interval is done by shifting the values of each feature so that the minimal value is 0, and then dividing by the new maximal value (which is the difference between the original maximal and minimal values). The values in the column are transformed using the following formula:
Logarithmic
The values in the column are transformed using the following formula:
Hyperbolic Tangent
All values are converted to a hyperbolic tangent. The values in the column are transformed using the following formula:
source: Normalize Data (Microsoft Azure)
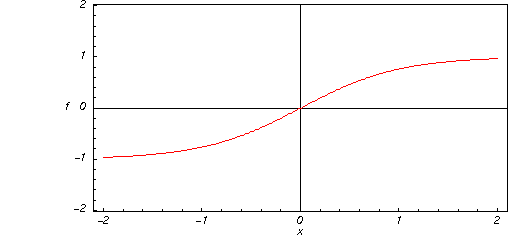
Here is a graphic of the hyperbolic tangent function for real values of its argument.

No comments:
Post a Comment