How exactly does one determine what "too frequently" means in regards to state changes for a particular host or service?
Whenever Nagios checks the status of a host or service, it will check to see if it has started or stopped flapping. It does this by:
- Storing the results of the last 21 checks of the host or service
- Analyzing the historical check results and determine where state changes/transitions occur
- Using the state transitions to determine a percent state change value (a measure of change) for the host or service
- Comparing the percent state change value against low and high flapping thresholds
A host or service is determined to have stopped flapping when its percent state goes below a low flapping threshold (assuming that it was previously flapping).
Let's describe in more detail how flap detection works with services...
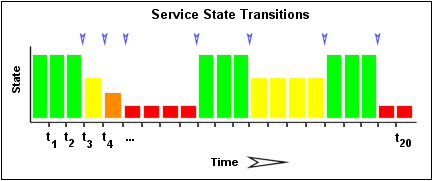
The image below shows a chronological history of service states from the most recent 21 service checks. OK states are shown in green, WARNING states in yellow, CRITICAL states in red, and UNKNOWN states in orange.

The historical service check results are examined to determine where state changes/transitions occur. State changes occur when an archived state is different from the archived state that immediately precedes it chronologically. Since we keep the results of the last 21 service checks in the array, there is a possibility of having at most 20 state changes. In this example there are 7 state changes, indicated by blue arrows in the image above.
The flap detection logic uses the state changes to determine an overall percent state change for the service. This is a measure of volatility/change for the service. Services that never change state will have a 0% state change value, while services that change state each time they're checked will have 100% state change. Most services will have a percent state change somewhere in between.
When calculating the percent state change for the service, the flap detection algorithm will give more weight to new state changes compare to older ones. Specifically, the flap detection routines are currently designed to make the newest possible state change carry 50% more weight than the oldest possible state change. The image below shows how recent state changes are given more weight than older state changes when calculating the overall or total percent state change for a particular service.

Using the images above, lets do a calculation of percent state change for the service. You will notice that there are a total of 7 state changes (at t3, t4, t5, t9, t12, t16, and t19). Without any weighting of the state changes over time, this would give us a total state change of 35%:
(7 observed state changes / possible 20 state changes) * 100 = 35 %
Since the flap detection logic will give newer state changes a higher rate than older state changes, the actual calculated percent state change will be slightly less than 35% in this example. Let's say that the weighted percent of state change turned out to be 31%...
The calculated percent state change for the service (31%) will then be compared against flapping thresholds to see what should happen:
- If the service was not previously flapping and 31% is equal to or greater than the high flap threshold, Nagios considers the service to have just started flapping.
- If the service was previously flapping and 31% is less than the low flap threshold, Nagios considers the service to have just stopped flapping.
source: https://assets.nagios.com/downloads/nagioscore/docs/nagioscore/3/en/flapping.html
No comments:
Post a Comment