Showing posts with label mathematics. Show all posts

Saturday, August 30, 2025

Benford's Law

Benford’s law describes the relative frequency distribution for leading digits of numbers in datasets. Leading digits with smaller values occur more frequently than larger values. This law states that approximately 30% of numbers start with a 1 while less than 5% start with a 9. According to this law, leading 1s appear 6.5 times as often as leading 9s! Benford’s law is also known as the First Digit Law.

If leading digits 1 – 9 had an equal probability, they’d each occur 11.1% of the time. However, that is not true in many datasets. The graph displays the distribution of leading digits according to Benford’s law.


Analysis of datasets shows that many follow Benford’s law. For example, analysts have found that stock prices, population numbers, death rates, sports statistics, financial and tax information, and billing amounts often have leading digits that follow this distribution. 

Uses for Benford’s Law

Analysts have used it extensively to look for fraud and manipulation in financial records, tax returns, applications, and decision-making documents. They compare the distribution of leading digits in these datasets to Benford’s law. When the leading digits don’t follow the distribution, it’s a red flag for fraud in some datasets.

When Does Benford’s Law Apply and Not Apply

Benford’s law generally applies to data that fit some of the following guidelines:

  • Quantitative data.
  • Data that are measured rather than assigned.
  • Ranges over orders of magnitudes.
  • Not artificially restricted by minimums or maximums.
  • Mixed populations.
  • Larger datasets are better.

Elaborations on Guidelines

Benford’s law often does not apply to assigned numbers, such as ID numbers, phone numbers, and zip codes.

It works best for data that range over multiple orders of magnitudes from very low to very high. You can cover the 10s, 100s, 1000s, and so on. For example, population and incomes can range from very low to very high.

Conversely, if the range of values is restricted, it affects the leading digits, and Benford’s law is less likely to apply. For example, human characteristics naturally fall into restricted ranges. Consequently, this distribution doesn’t apply to human ages, heights and weights. Similarly, limits imposed on potential values can also invalidate this law. Awards in small claims courts have an upper limit, which can negate Benford’s law.

Interestingly, mathematicians have proven that numbers from mixed populations follow Benford’s law. Mixed populations are things like all numbers pulled from a magazine issue. Obviously, those numbers will represent various topics and types of values. Benford himself did that with Reader’s Digest and newspapers. You can also combine data from different sources to achieve the same effect.

Like all distributions, larger datasets will produce observed relative frequencies that more closely approximate the theoretical values of Benford’s law. Smaller datasets can create relatively large deviations due to random error. Some analysts say datasets as small as 100 are acceptable, but most think a minimum size of 500 or even 1,000 is necessary.

Curiously, it will work in some cases where it should not. For example, it applies to house numbers even though those are assigned.

Benford’s Law Formula

Benford’s law formula is the following:

Where d = the values of the leading digits from 1 to 9.

The formula calculates the probability for each leading digit. The table below displays the probabilities that Benford’s law formula calculates for all digits.

Digit     Probability

1     30.1%

2     17.6%

3     12.5%

4     9.7%

5     7.9%

6     6.7%

7     5.8%

8     5.1%

9     4.6%

source: https://statisticsbyjim.com/probability/benfords-law/

Saturday, April 15, 2023

monotonic sequence

A monotonic sequence is always increasing or always decreasing. Monotonicity does not imply uniform increasing (or decreasing) values. That is, the values may not be strictly sequential. While 1, 2, 3, 4 is a monotonic sequence, so is 4, 125, 291, 1424. 

Example usage: ServiceBusReceivedMessage.SequenceNumber Property

The sequence number is a unique 64-bit integer assigned to a message as it is accepted and stored by the broker and functions as its true identifier. For partitioned entities, the topmost 16 bits reflect the partition identifier. Sequence numbers monotonically increase. They roll over to 0 when the 48-64 bit range is exhausted.

That it can roll over means it's not strictly monotonic.

Monotonicity in election methods

Monotonicity is an election method criterion that requires the following:

Ranking or rating a candidate higher should never cause that candidate to lose, nor should ranking or rating a candidate lower ever cause that candidate to win, assuming all other candidates remain rated or ranked the same.

In other words, an election method is non-monotonic if either of the following is possible:

  • A winner can be changed to a loser by experiencing an increase in support, OR
  • A loser can be changed to a winner by experiencing a decrease in support.

One noteworthy non-monotonic election method is instant runoff voting (IRV).

source: https://electionscience.org/library/monotonicity/


Friday, January 14, 2022

involute

Involute has many definitions across multiple disciplines (e.g., mathematics, engineering, botany, and biology). Following are a few of the definitions in brief sourced from multiple sites.

  • adj.: involved or intricate
  • adj.: curled inward (typically spirally)
  • verb: to decrease in size after an enlargement
  • noun: a particular type of curve that is dependent on another shape

One common application of this type of curve is in the design of gear teeth.


Mathematically, the flight of a tetherball approximates the involute of the pole.


Seeing the involute of a square helps illustrate what is happening.

The shape from which the involute is formed in named the evolute.


Example of an involute shell.


Example of an involute leave.

Saturday, August 28, 2021

Braess's paradox

Braess's paradox is the observation that adding one or more roads to a road network can slow down overall traffic flow through it. The paradox was postulated in 1968 by German mathematician Dietrich Braess.

The paradox may have analogies in electrical power grids and biological systems. It has been suggested that in theory, the improvement of a malfunctioning network could be accomplished by removing certain parts of it. The paradox has been used to explain instances of improved traffic flow when existing major roads are closed.

The idea behind Braess's discovery is that the Nash equilibrium may not equate with the best overall flow through a network.

Adding extra capacity to a network when the moving entities selfishly choose their route can in some cases reduce overall performance. That is because the Nash equilibrium of such a system is not necessarily optimal. In a Nash equilibrium, drivers have no incentive to change their routes. While the system is not in a Nash equilibrium, individual drivers are able to improve their respective travel times by changing the routes they take. In the case of Braess's paradox, drivers will continue to switch until they reach Nash equilibrium despite the reduction in overall performance.


source: https://en.wikipedia.org/wiki/Braess%27s_paradox


Saturday, May 29, 2021

Weber's Law of Just Noticeable Differences

Weber's Law states that the ratio of the increment threshold to the background intensity is a constant. So when you are in a noisy environment you must shout to be heard while a whisper works in a quiet room. And when you measure increment thresholds on various intensity backgrounds, the thresholds increase in proportion to the background. Weber's Law predicts a linear relationship between the increment threshold and the background intensity.

source: https://www.cis.rit.edu/people/faculty/montag/vandplite/pages/chap_3/ch3p1.html

Weber's Law (pronounced vay-ber) can be applied to variety of sensory modalities (brightness, loudness, mass, line length, etc.).  The size of the Weber fraction varies across modalities but in most cases tends to be a constant within a specific task modality.

source: http://apps.usd.edu/coglab/WebersLaw.html

It has been shown not to hold for extremes of stimulation.

source: https://www.britannica.com/science/Webers-law


Monday, April 12, 2021

Zipf's law

Zipf’s (basic) law states that, across a corpus of natural language, the frequency of any word in that corpus is inversely proportional to its rank in the frequency table.

So the most frequent word, ranking first in the frequency table, sets the frequency for all the other, less frequent words. The second most frequent word is half (1/2) as common as that, the third is one-third (1/3) as common, and so on. This is readily seen in the two graphs, the first of which uses normal linear scale in its axes, and the second uses logarithmic scales, which transforms the curve into a straight line.

Zipf's (basic) law shown in word frequencies in a corpus of written or spoken language, with linear axis scales.
Zipf’s (basic) law shown in word frequencies in a corpus of written or spoken language, with linear axis scales.
The same values, this time with both axes being logarithmic in scale, transform the curve into a straight line.
The same values, this time with both axes being logarithmic in scale, transform the curve into a straight line

source: https://eclecticlight.co/2015/07/11/zipfs-law-deep-and-meaningful/ 

"Zipf's law, the rank vs. frequency rule, also works if you apply it to the sizes of cities. The city with the largest population in any country is generally twice as large as the next-biggest, and so on. Incredibly, Zipf's law for cities has held true for every country in the world, for the past century."

source: https://io9.gizmodo.com/the-mysterious-law-that-governs-the-size-of-your-city-1479244159

Zipf's law is close even for the largest US states (in square miles).

1 
Alaska 570,641
2 
Texas 261,914 2.18
3 
California 155,973 3.66
4 
Montana 145,556 3.92
5 
New Mexico 121,365 4.70
6 
Arizona 113,642 5.02

Additional: https://en.wikipedia.org/wiki/Zipf%27s_law

Friday, April 24, 2020

SLAM

Simultaneous localization and mapping

What Is Simultaneous Localization and Mapping?

SLAM is a commonly used method to help robots map areas and find their way.

Using SLAM, robots build their own maps as they go. It lets them know their position by aligning the sensor data they collect with whatever sensor data they’ve already collected to build out a map for navigation.

https://blogs.nvidia.com/blog/2019/07/25/what-is-simultaneous-localization-and-mapping-nvidia-jetson-isaac-sdk/

SLAM algorithms are tailored to the available resources, hence not aimed at perfection, but at operational compliance. Published approaches are employed in self-driving cars, unmanned aerial vehicles, autonomous underwater vehicles, planetary rovers, newer domestic robots and even inside the human body.

https://en.wikipedia.org/wiki/Simultaneous_localization_and_mapping


Saturday, June 22, 2019

optimal stopping

Having reached the 12th week of the process to hire a new employee, I recalled videos I had seen on how to know when to stop (see below). The examples are a bit simplified compared to hiring a real person, after all, the candidate must also decide when to stop looking for a job. Since either party can decline the relationship, the term "optimal" may not apply. Nevertheless, the optimal stopping theory does provide a good principle for how to establish a baseline of acceptability among the candidates. The theory works best with a known number of candidates or a limited amount of time to make the decision.

Optimal Stopping

Brian Christian, coauthor, with Tom Griffiths, of Algorithms to Live By. He writes, codes & lives in San Francisco. In an article on medium.com, he wrote:
If you want the best odds, spend 37% of your hunt noncommittally exploring options. You’re just calibrating. But after that point, be prepared to immediately commit  to the very first candidate you see that beats whatever you’ve already seen. This is not merely an intuitively satisfying compromise between looking and leaping. It is the provably optimal solution.
37% = 1/e

YouTube Videos


Optimal Stopping. The Secretary Problem Explained. Taken from a chapter of the book "Algorithms to Live By - The Computer Science of Human Decisions" by Brian Christian and Tom Griffiths

Saturday, September 22, 2018

Bayesian _______

Bayesian _______

estimation

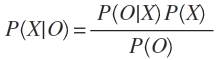
The problem is the quality of a 5 star rating depends not only on the average number of stars but also on the number of reviews. Bayesian estimation attempts to forgo computing a direct value from a limited number of observations and instead creates a probability distribution. It would seem clear that a 4.1-star rating with hundreds of reviewers has many that are happy. Therefore, it should probably appear before a 5-star rating with only one reviewer even though its average rating is lower. Bayes formula tells us how to compute the probability of X given O:

source: Computing a Bayesian Estimate of Star Rating Means

model

A Bayesian model can explicitly account for:
  • Time. Perhaps old ratings should count for less than new ratings.
  • Prior beliefs. Perhaps an unrated item from a bestselling author should appear above an unrated item from an unknown author.
  • Attitudes toward risk. Exactly how risk-averse should the algorithm be about promoting items with a small number ratings?
source: Bayesian Average Ratings

trap

"The Bayesian Trap" Veritasium on YouTube. Bayes' theorem explained with examples and implications for life.

logic

Combine probabilistic logic and Bayesian networks to obtain the advantages of each in what is called Bayesian logic. Like probabilistic logic, it is a theoretically grounded way of representing and reasoning with uncertainty that uses only as much probabilistic information as one has, since it permits one to specify probabilities as intervals rather than precise values.

network

A Bayesian network is an augmented, directed acyclic graph, where each node corresponds to a random variable x and each edge indicates a direct influence among the random variables.

probability

Bayesian probability is an interpretation of the concept of probability, in which, instead of frequency or propensity of some phenomenon, probability is interpreted as reasonable expectation representing a state of knowledge or as quantification of a personal belief.

statistics

Bayesian statistics is a mathematical procedure that applies probabilities to statistical problems.

source: Bayesian Statistics explained to Beginners in Simple English

analysis

Bayesian analysis is a statistical paradigm that answers research questions about unknown parameters using probability statements. In Bayesian analysis, a parameter is summarized by an entire distribution of values instead of one fixed value as in classical frequentist analysis. Unique features of Bayesian analysis include an ability to incorporate prior information in the analysis, an intuitive interpretation of credible intervals as fixed ranges to which a parameter is known to belong with a prespecified probability, and an ability to assign an actual probability to any hypothesis of interest.

inference

Bayesian inference is a method of statistical inference in which Bayes' theorem is used to update the probability for a hypothesis as more evidence or information becomes available.

Bayes’ theorem

Bayes’ theorem describes the probability of an event, based on prior knowledge of conditions that might be related to the event. For example, if cancer is related to age, then, using Bayes’ theorem, a person’s age can be used to more accurately assess the probability that they have cancer, compared to the assessment of the probability of cancer made without knowledge of the person's age.

Named for Thomas Bayes, an English clergyman and mathematician, Bayesian logic is a branch of logic applied to decision making and inferential statistics that deals with probability inference: using the knowledge of prior events to predict future events.

Sunday, August 12, 2018

nomogram

Graphical calculators such as this are known of nomograms, and are often both an art and a science.
Multiplying with a Parabola! For example,
using y = x2
8 x 5 = 40

Saturday, August 4, 2018

Markov Chain

A Markov chain is a mathematical system that experiences transitions from one state to another according to certain probabilistic rules.


source: https://brilliant.org/wiki/markov-chains/