
Showing posts with label visualization. Show all posts
Showing posts with label visualization. Show all posts
Saturday, April 27, 2024

Saturday, August 25, 2018
dendrogram
A dendrogram (from Greek dendro "tree" and gramma "drawing") is a tree diagram frequently used to illustrate the arrangement of the clusters produced by hierarchical clustering. - source: https://en.wikipedia.org/wiki/Dendrogram
In data mining and statistics, hierarchical clustering (also called hierarchical cluster analysis or HCA) is a method of cluster analysis which seeks to build a hierarchy of clusters. Strategies for hierarchical clustering generally fall into two types:
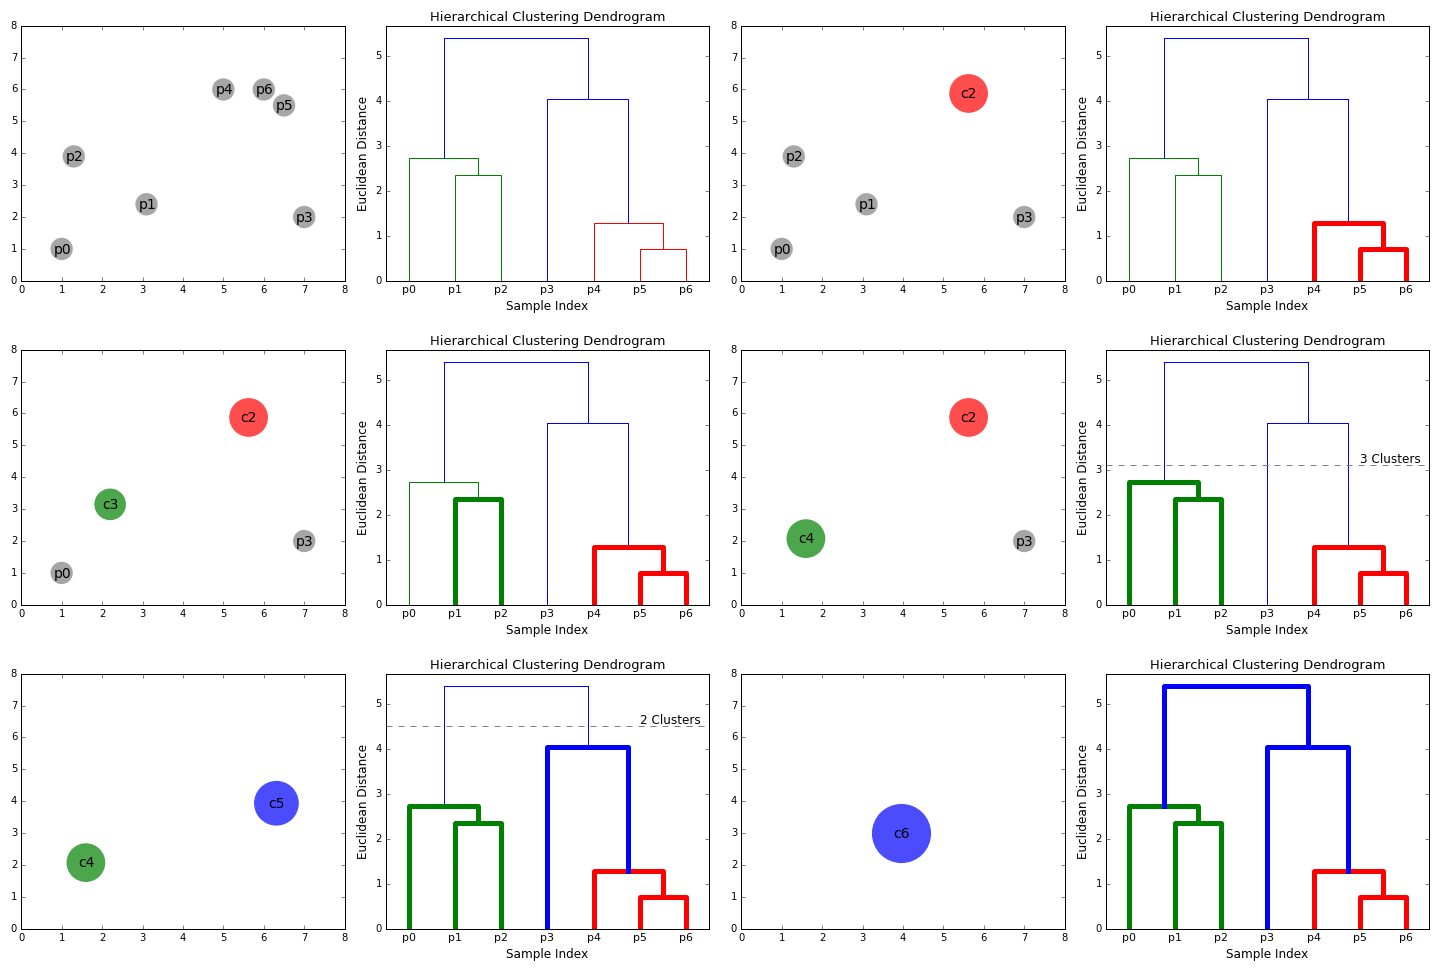


In data mining and statistics, hierarchical clustering (also called hierarchical cluster analysis or HCA) is a method of cluster analysis which seeks to build a hierarchy of clusters. Strategies for hierarchical clustering generally fall into two types:
- Agglomerative: This is a "bottom up" approach: each observation starts in its own cluster, and pairs of clusters are merged as one moves up the hierarchy.
- Divisive: This is a "top down" approach: all observations start in one cluster, and splits are performed recursively as one moves down the hierarchy.
source: Hierarchical clustering (wikipedia)
Sunday, August 12, 2018
HSL and HSV (Hue, Saturation and Lightness/Value)
![]() HSL
and HSV (Hue, Saturation and Lightness/Value)
HSL and HSV
are used in color pickers and sometimes to define gradients for data
visualization. The popular GIS program ArcGIS historically applied
customizable HSV-based gradients to numerical geographical data.
HSL or HSV is often more convenient than RGB. The CSS 3 specification
allows web authors to specify colors for their pages directly with HSL
coordinates.
http://en.wikipedia.org/wiki/HSL_and_HSV describes the difference between HSL and HSV.
Note that
HSB (brightness) is not the same as HSL, but is the same as HSV.
Curiously, the Microsoft Office HSL color picker labels L “Lum”
(luminosity), but appears to be the same as lightness.
The blue icons are displayed in
grayscale by setting the saturation to zero using CSS.
BTW, CSS also offers
hsla and rgba, which add the
alpha channel to control opacity/transparency.
Panini Projection
The
general Panini projection is suitable for architectural subjects,
especially interiors. It works best for views with a single central
vanishing point -- straight down a city street,
or the aisle of a church, for example. It is an excellent 'de-fishing'
tool.

Engineer on WordMap
Many of the words have audio pronunciations. Click on a word to hear it spoken.
The Indo-European connection is easily seen (click on the word in India).
Digital Twin

“The digital representation is later used for visualization, modeling, analysis, simulation and further planning.”
“Technologies like augmented reality in construction are emerging to digitalise the construction industry, making it significantly more effective.”
Useful application of digital twins in construction
- Automated progress monitoring
- As-built vs as-designed models
- Resource planning and logistics
- Safety monitoring
- Quality assessment
- Optimization of equipment usage
Getting Data for Digital Twins
- Smartphone Cameras
- Time-Lapse Cameras
- Autonomous UAV and Robots
- Video Surveillance Cameras
- Head-mounted Cameras and Body Cameras
Image data processing algorithms for digital twin creation
- 3D Reconstruction: Conventional Photogrammetry
- 3D Reconstruction: Structure from Motion
- Object Detection and Recognition
- Localization
- Object Tracking
Full article:
Even an entire city can have a digital twin: Virtual Singapore
Thursday, September 5, 2013
treemap
Introduced by Ben Shneiderman in 1991, a treemap recursively subdivides area into rectangles. As with adjacency diagrams, the size of any node in the tree is quickly revealed. “Squarified” treemaps use approximately-square rectangles, which offer better readability and size estimation than naïve “slice-and-dice” subdivision.
- D3.js provides a treemap for data visualization.
- D3.js provides a treemap for data visualization.
Seen below, this treemap shows the whole contents of a directory tree on your Windows hard drive. The treemap represents each file as a colored rectangle, the area of which is proportional to the file's size. The rectangles are arranged in such a way, that directories again make up rectangles, which contain all their files and subdirectories. So their area is proportional to the size of the subtrees. The color of a rectangle indicates the type of the file, as shown in the extension list. The cushion shading additionally brings out the directory structure.
- http://windirstat.info/
- http://windirstat.info/

Personal Note
Back in the late 80s, I read Shneiderman’s book Designing the User Interface, which had a profound effect on me. One rule I still remember is 7 ± 2 because people can generally store 5 – 9 things in their short term memory. In application, this means that menus should have between 5-9 items. More than 9 requires the user to waste extra time sorting through all the options.
Subscribe to:
Posts (Atom)